
Churn Analytics
Churn is the loss of business that you incur due to the discontinuation of services by a customer. A customer could decide to discontinue the service because he no longer…
Churn is the loss of business that you incur due to the discontinuation of services by a customer. A customer could decide to discontinue the service because he no longer needs the service or is not happy with the quality of service or a better deal offered by the competitor or for similar other reasons.
Organizations often give more priority to acquiring new customers than putting effort into retaining the existing ones. But obviously, this turns out to be a losing battle as acquiring new customers is five times more expensive than retaining an existing one.
Churn analytics help plug the silent leak in the customer stream by providing actionable insights to prevent the churn.
Apart from reducing revenue loss, churn analytics have certain indirect benefits:-
- Tracking and Managing Customer Issues – > Improved credibility of customer service
- Lowers the need for customer acquisition -> Reduce acquisition cost
- Understand customer’s journey, maturity needs -> Improved up-selling and cross-selling
Understanding and preventing churn
Churn prevention may start with understanding details around who is churning – what do they look like, where do they stay, what product/service they are using, how much they spend, etc. A churn dashboard can give you all these insights for ready consumption. Techniques such as RFM analysis uses some of these attributes about customers to segment them into different buckets and provide insights into their behavior.
The possible thing is to analyze when they are churning. Cohort Analysis provides a powerful tool in understanding typically how long customers stay before churning out.
Once you understand who is churning and when the next most important thing to analyze is ‘Why are they churning? This may involve collecting feedback and other customer interaction data a doing a deep dive on reasons for churn.
Finally, you could stay one step ahead of churn by using ML technique to predict churn
Once you have developed a detailed understanding of have sufficient insights, the next step is to reduce churn by either:-
- Fixing reasons for customer Unhappiness
- Improving product, services
- Initiating a proactive campaign to communicate that you care
RFM Analysis
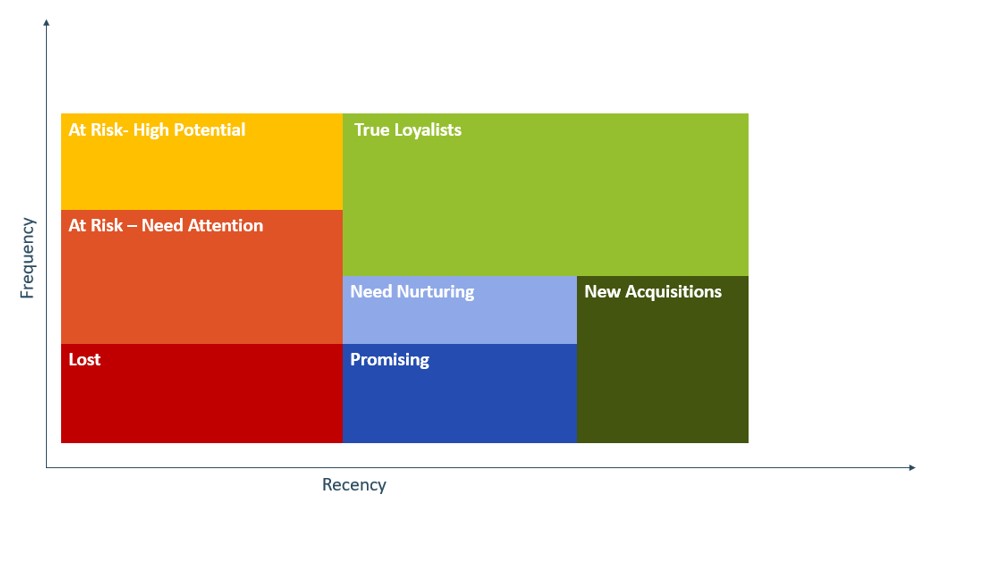
One of the most popular approaches to predict churn is RFM analysis. RFM uses a clustering algorithm that segments the customer according to their recency, frequency, and monetary spend similarity. This clustering can help create segments, thus identifying – Most Loyal customers, Hibernating or At-Risk customers, etc. Identifying the customer’s current state gives a fair idea about how invested the customer is in your brand and if anything has changed off-late that might drive him away. For example, a constant decrease in the customer’s average spending might indicate impending churn. The following chart shows how RFM analysis clusters identify a segment of customers and can help predict churn behavior.
You can leverage the RFM clusters further for micro segmenting using other demographical data such as location, millennial or senior citizens, etc. Micro-segmentation helps businesses know the target customer better and take customized marketing actions to prevent churn.
Cohort Analysis
A group of people with shared characteristics is known as a cohort. Cohort analysis is observing the behavior of a group over a period. Here, instead of treating all the users as equal, you categorize them and study them as different groups or cohorts.
One of the widespread analyses is studying the acquisition cohorts. Acquisition cohorts are performed on the groups of customers segmented based on the day/time when they have signed up for the product/service.
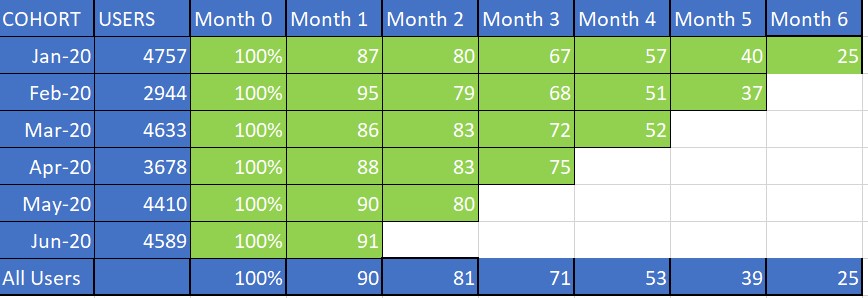
E.g., the above cohort chart shows us the customer lifecycle, which informs us how many users the business has acquired over the period, how many have churned among them, and how many are still active. So if you want to study the characteristics or behavior of people who stayed back after two months (irrespective of when they joined your band ), all the customer in Column Month 2 above gives you that group of customers.
This type of analysis gives you a fair idea of what point your users are dropping off and helps you identify anomalies in the churning. Later, with this insight, you can dig deeper into the behavioral analysis, which may provide you the actual reason for churn.
Feedback Analysis
Evaluating the reasons for churning can be a practical approach to understand and prevent churn. It gives you a chance to introspect, get to the root of the matter and solve their issues. Customer’s lifetime interaction with businesses, such as complaints, inquiries, service requests, etc.) can give tons of valuable insights into customer’s reasons for eventually churning out.
But often, the customers may not call you to convey their problems regarding the product or services they are receiving; most of the time, the customers might wither away silently without communicating their issues. In such cases, you might want to collect the data through an automated survey generated at the time of a subscription cancellation or by sending an email and asking ‘the reason for churn.’
Once you have collected formal and informal feedback, the next is to find insights into it. Text Analytics techniques can provide some automated insights in detecting common topics/categories and areas of concern. It can also give details on customer’s sentiment around some of the topics. Combining the two can help dissect complex and mixed feedbacks, e.g., “This product is useful, but the price is quite high” consists of both positive and negative aspects that need to be grouped under two different categories for better insights.
The extracted text insights can be further analyzed to know some of the top reasons for customer unhappiness, how these change for a product, region, mode of communication, or other dimensions. You can also predict churn by analyzing some of the ongoing complaints raised by your subscribers and identifying customers with complaints similar to the ‘high churn’ reason.
Predictive Analysis
Churn prevention is a proactive strategy taken by businesses to retain customers. This includes predicting the likelihood of a customer to churn by analyzing the past churn and behavioral attributes associated with churn. Typical ML algorithms used for predicting churn include logistic regression, Decision Trees, Random Forest, etc.
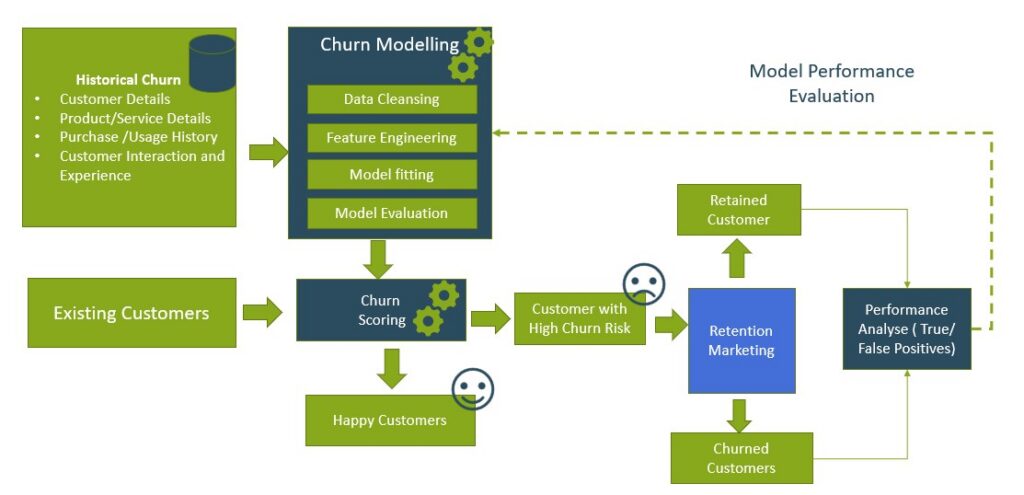
Some of the significant data points considered for modeling customer churn behavior are as follows:
- Customer details – These include customer’s attributes such as age, gender, address, income level, profession, family size, the source of acquisition, etc.
- Products/ Service-related information – This includes information about the product or services the customers have procured. These could have attributes like product type, features, cost, type of usage, etc.
- Purchase/ Usage History – This includes active participation and interest of the customer in your product/ brand/ service. Some examples of this data include frequency of purchase, date of last purchase, time of day/season of purchase, amount, payment methods they use, balances/store credit, etc.
- Customer Interactions – This includes customer’s actions and interactions with the brand in the past, e.g., the number of store visits, frequency of complaints, active complaints, etc.
Churn Scoring
Once you have developed the churn model by modeling the historical churn behavior, it can score the existing customers. This will give you the churn scores at an individual customer level indicating the likelihood of that customer’s churning. The likelihood score can help you prioritize and plan proactive intervention strategies to reduce churn.
Actioning the Churn Insights
Churn prediction scores can help an organization identify which customers are at the risk of churning out. However, these insights need to be acted upon to minimize the churn. This may involve marketing, reaching out to the customers with specific offers, or correspondence appeasing the customers. Different customers might be at a different stage of their journey, show diverse behaviors, and have a unique reason for churning. Hence, it is vital to send targeted messages to each customer to increase the chances of retention.
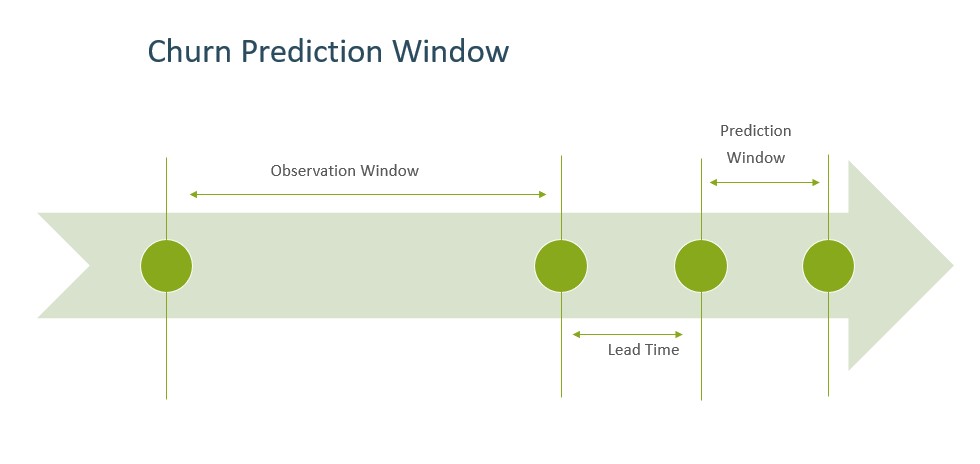
One of the crucial aspects to consider while embarking on a churn prediction project is to know how well in advance you need to have insights to act. This period is called the lead window. It’s your window of opportunity to reach out to customers with a targeted marketing offer or a correspondence and take preventive actions.
The actual churn score itself is derived by looking at the observation window data. The observation window can typically last six months or years or more, depending on the nature of the business. All the customer activities during this window form a crucial input to feed to the churn model.
The prediction window is where you track the impact of your proactive intervention. This is the window during which you observe if you were able to retain the customer or not


You Might Be Interested In

Unleashing the Power of Large Language Models
In today's digital age, Artificial Intelligence (AI) continues to push the boundaries of what's possible, and one area that's capturing widespread attention is Large Language Models (LLMs). These sophisticated AI…

Death of Third Party Cookie Part 1
By now, all the marketers are aware of Google's plan to phase out third-party cookies in Chrome. It's not too far. By the end of 2023, the third-party cookie will…

Marketing Automation
Organizations with a sizable inflow of users on their website or mobile application grapple with the task of managing these leads for effective conversion. Users looking at your products/services may…